Monitoring and limiting traffic in the local network on a router with OpenWrt
As the number of users increases, it is time to introduce speed limits in the network.
While I do not need this on my home router, in corporate use, it is worth knowing who and how much is using the connection and, if necessary, introducing appropriate restrictions.
First, you need to find out who, and then how much.
So let’s start with the tools to monitor our connection.
Optimised for OpenWrt 25.12 using
apkinsteadopkg
Monitoring
Depending on how much information we need, we can install two packages from the router: luci-app-vnstat2 or luci-app-nlbwmon.
luci-app-vnstat2
apk update
apk add luci-app-vnstat2
After installing the package, you will see an additional option in the menu Status > VnStat Traffic Monitor
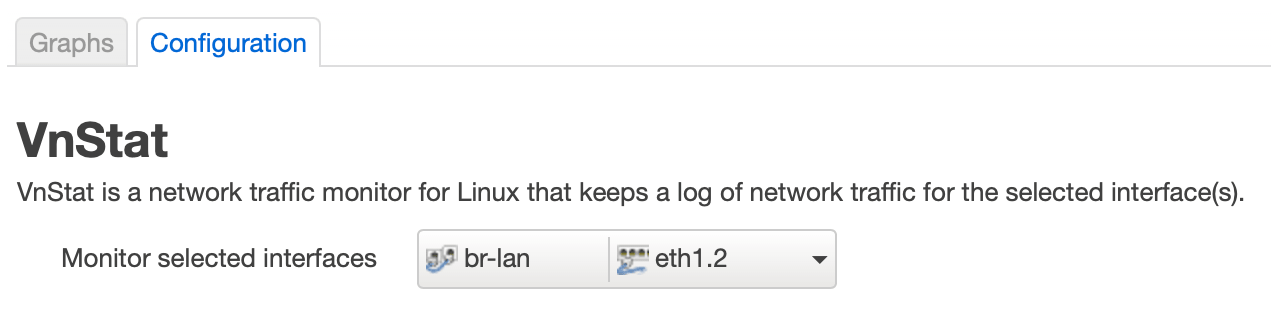
By default, the application will be configured to monitor traffic in our local network (br-lan) and the basic Internet connection (eth1.2). If not, go to the Configuration tab and in Monitor interfaces select what we want to monitor.
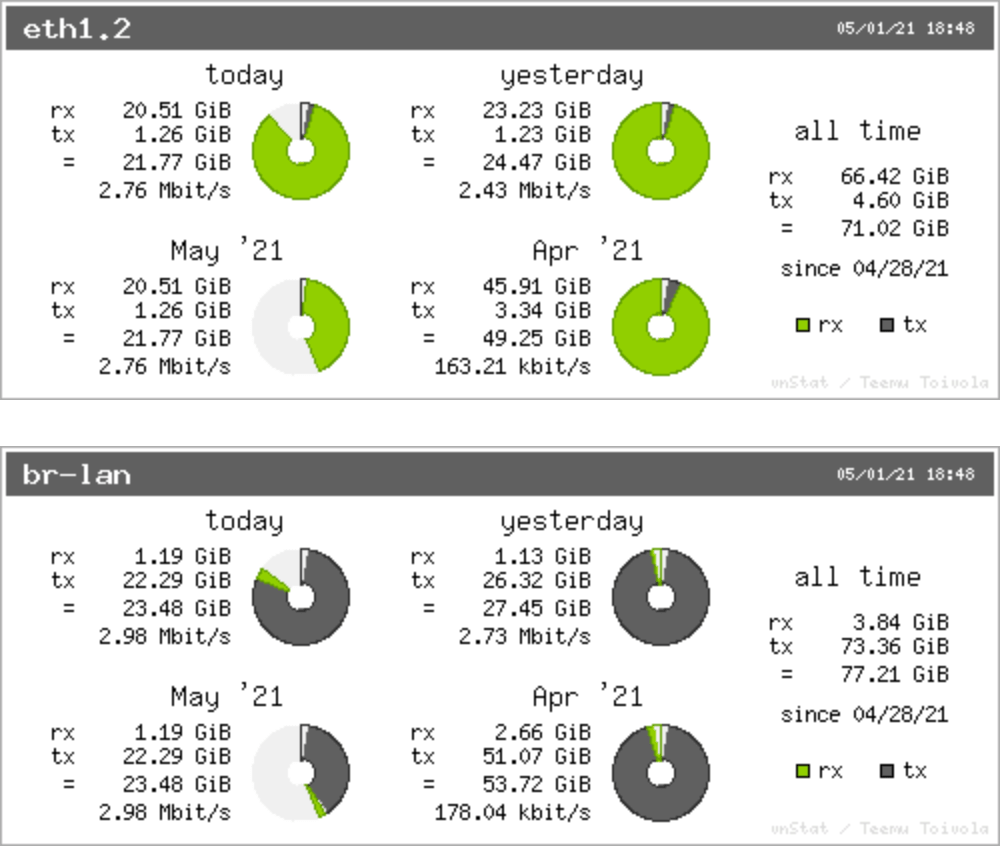
In the main section VnStat Graphs we have several methods of presenting the collected data.
Summary display we receive information in the form of data and graphs, how much data we have collected today, yesterday, this month and in the previous month.
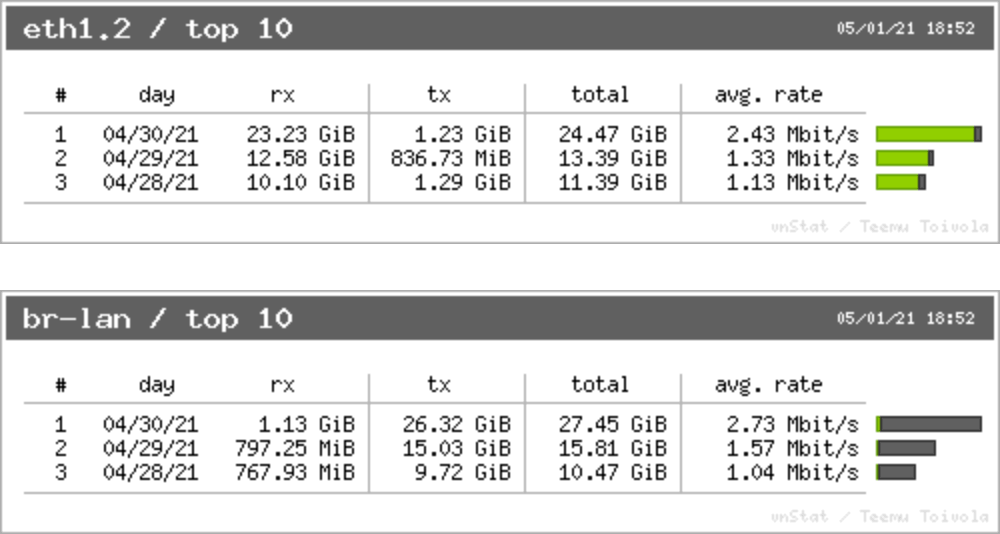
Top 10 display will show us the 10 busiest days in our network. Of course, we have to allow our router to collect them, so we won’t see everything at once.
Hourly traffic will show us the load for the last 24 hours. Similarly, Daily traffic translated into days and Monthly traffic months.
We will not receive any information about who has stressed our connection. This package will mainly serve us to analyze how much we use our connection.
luci-app-nlbwmon
apk update
apk add luci-app-nlbwmon
This package gives us insight into even more information.
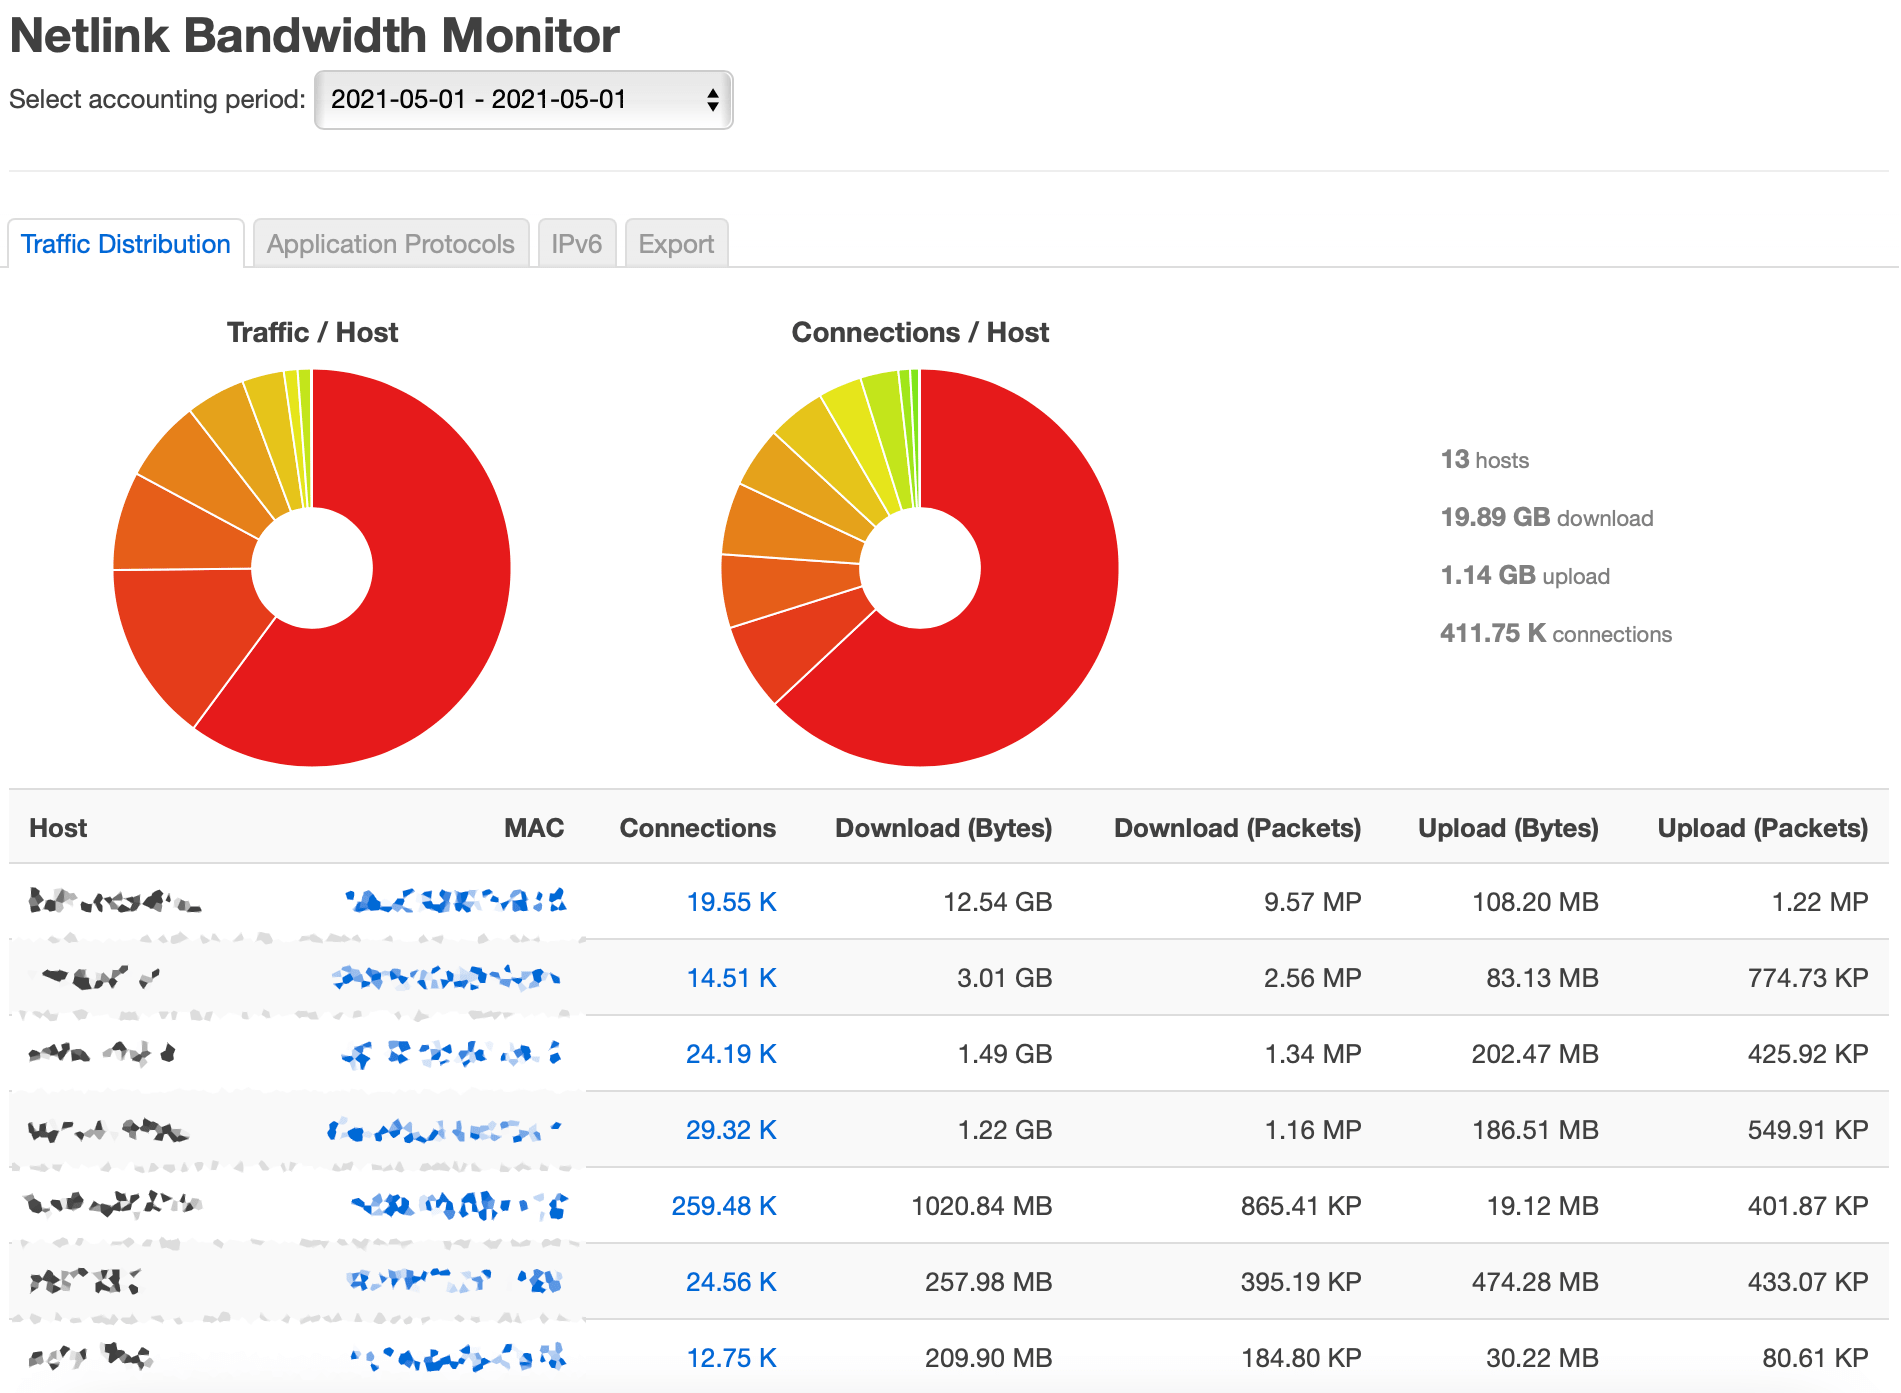
We have a dedicated Bandwidth Monitor menu (or Services > Bandwidth Monitor) with extensive configuration options (Configuration) and the ability to save data collected over time (Backup), as well as restore it. Particularly useful in the case of firmware update on the router.
In the Display tab we will get a preview of how individual users in our network loaded our connection (Traffic Distribution).
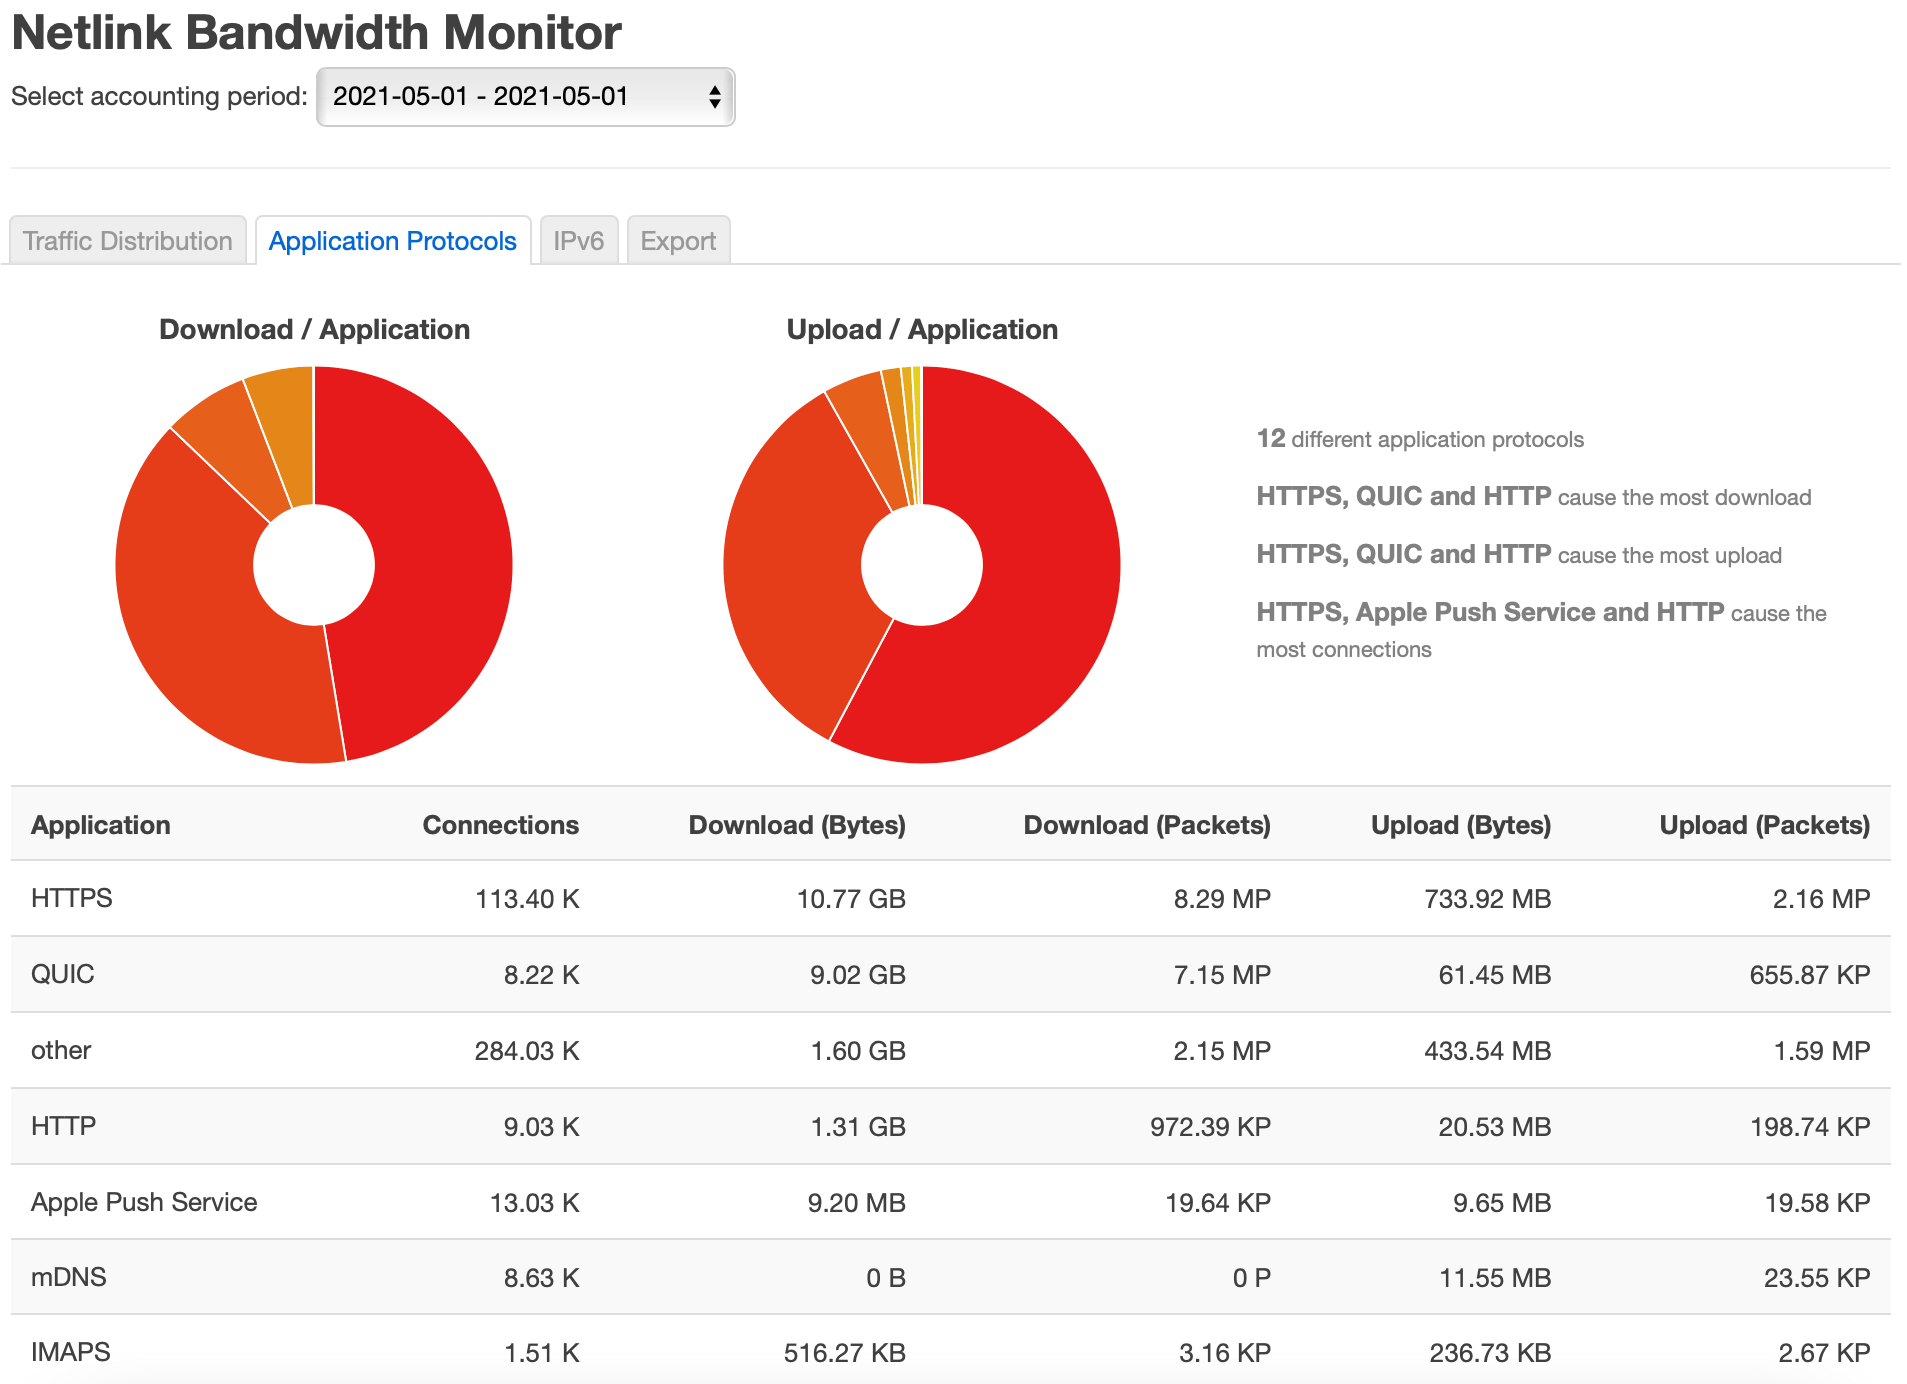
Including the division into protocols of individual applications (Application Protocols)
If communication in our network takes place via both IPv4 and IPv6, the IPv6 tab will show us how traffic is divided depending on the communication method.
What’s more, in the Export tab we can save the collected data in several formats, allowing for their later analysis in external programs.
There is nothing against installing both packages and deciding which one is better in the next few days. A lot of users notice that nlbwmon skips some traffic, which is why its statistics are lower than vnstat.
Of course, it should be noted that in vnstat we can set which interfaces are to be monitored by it (by default our main Internet connection and local network). In the case of nlbwmon, the interface responsible for the local network is monitored by default (however, this also includes transfer from WireGuard clients, if we have it installed according to my other post).
Overall, everything is fine, but I still feel there’s something missing here.
So I would like to know what the current usage of the internet connection is. At a given moment, at what speed a given user is downloading something. This is especially important in the next step, where we will want to limit what some people do.
OpenWrt theoretically has a built-in monitoring system (Status > Realtime Graphs).
In addition to the graphical charts, we have the Realtime Rate tab, which should show live current bandwidth usage by individual IP addresses.
Once we have gathered information about who we need to impose restrictions on, it is time to implement them.
Bandwidth Management and Prioritisation
Starting with OpenWrt 25.12,
luci-app-nft-qoshas been officially dropped. For modernnftablesbased rate limiting and prioritisation, we now use theluci-app-qosmatepackage.
apk update
apk add luci-app-qosmate
After installation, the QoSmate option will appear in the Network menu.
Traffic Prioritisation (VoIP)
In the Prioritization settings, we can ensure that critical network traffic takes precedence over bulk downloads. This is essential for environments with multiple VoIP phones; it prevents a large file transfer from causing jitter or delays in a voice conversation.
Once you enable the prioritisation engine, you can define rules based on ports or protocols. For instance, you can ensure the SIP/VoIP protocol (port 5060) is treated as high priority, while standard HTTP (80) or HTTPS (443) traffic is handled with a lower priority.
Rate Limiting (Per-User Control)
In the Rate Limiter tab, we can impose specific bandwidth caps on individual users. To get started, you must first tick the Enable box.
You can define limits based on IP addresses or MAC addresses. For the best results, it is highly recommended to assign fixed IP addresses to your devices via Network > DHCP and DNS > Static Leases. This ensures that your rules always apply to the correct hardware.
A note on units: Pay close attention to the units used in the configuration. Megabit/s (Mbps) is not the same as Megabyte/s (MB/s). A 100Mbps connection translates to approximately 12.5MB/s. You can use an online converter if you are unsure of the values to enter.
Static vs. Dynamic Management
QoSmate allows you to set a Default Rate for any device not explicitly listed in your rules. For example, on a 100/100 Mbps connection, you might set the default for unidentified guests to 5/5 Mbps, while identified workstations receive higher limits.
One of the strengths of the modern QoSmate approach is its move toward more “fair” queuing. While nft-qos often relied on hard, static “policing” (which wastes bandwidth when the network is idle), QoSmate aims to keep latency low for everyone.
The “Dynamic” Challenge
I am still looking for a perfect “middle ground” solution—the ability to keep limits low during periods of high demand, but allow a single user to burst to the full available speed when the rest of the network is quiet. It can feel restrictive to cap a user at 5Mbps if they are the only person in the building using the internet. As I continue to explore the advanced capabilities of QoSmate and its integration with SQM (Smart Queue Management), I will update this guide if I find a more flexible “burst” configuration.
If you care about monitoring other parameters from routers in addition to transfer monitoring, the
luci-app-statisticspackage will be indispensable for you. This package, together with the list of modulesapk search collectd-modwill significantly expand the capabilities of our device.
Regards.

Comments & Reactions